Disclaimer/Remark: The title of this article is an exact replication based on the article I found in facebook. I am a Physicist and I have a background about this conspiracy theory and it's related program that was launched in early 1990's. Tesla had this idea before that setting a certain frequency can induced massive earthquake but Discovery Channel's mythbuster attempted to recreate a set up which allegedly can cause an earthquake but it failed. It's up to you to believe this article I found in facebook or not. In Physics everything is possible but that doesn't mean that Physics is limitless.
Also read, Honda FCX - THE CONSPIRACY THEORY OF JAPAN 9.0 MAGNITUDE EARTHQUAKE
The article published in facebook as cited at the bottom of this page starts here:
The United States Air Force and Navy has provide a visual insight into what caused the 9.0 magnitude off of Japan on March 11, 2011at 5:46:23 UTC.
The image was downloaded from the High Frequency Active Auroral Research Program (HAARP) website. - http://www.haarp.alaska.edu/haarp/index.html
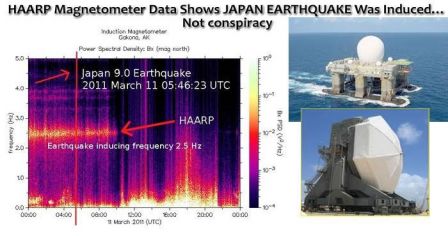
Above is a time-frequency spectrogram, which shows the frequency content of signals recorded by the HAARP Induction Magnetometer. This instrument, provided by the University of Tokyo, measures temporal variations in the geomagnetic field (Earth's magnetosphere) in the ULF (ultra-low frequency) range of 0-5 Hz. Notions have been added to the image to show you what was happening the day the Japan earthquake and tsunami struck.
By looking at the accompanying HAARP spectrum chart above you can see when the 9.0 magnitude earthquake struck red line drawn vertically and what was happening before and after the earthquake. What you can also see is a constant ULF frequency of 2.5 Hz being recorded by the magnetometer. The ULF 2.5 Hz frequency is evidence of an induced earthquake. The chart recorded this constant before, during and after the 9.0 magnitude earthquake struck.
On March 11, 2011 the 2.5 Hz ULF frequency was being emitted and recorded from 0:00 hours to about 10:00 hours -- or for 10 hours. We know for a fact that the Japan earthquake lasted only a few minutes so why was the earthquake signature frequency (2.5 Hz) being recorded for 10 hours on the morning of March 11, 2011? Because a HAARP phased array antenna system was broadcasting (transmitting) the 2.5Hz ULF frequency and it triggered the Japan earthquake and ensuing tsunami.
If you go to HAARP's official website you can see for yourself that the 2.5 Hz ULF frequency wasn't only being broadcated for 10 hours, it was constantly being broadcasted for 2 days prior to the earthquake. Broadcasting began on March 8, 2011, just before midnight as you can see on HAARP's website page.
Click on the Next Day link to see that the earthquake inducing 2.5 Hz ULF frequency was being broadcasted for the entire days of March 9, 2011 and March 10, 2011. Even though the signature frequency of an earthquake was shown throughout March 9 and March 10 there were no constant earthquakes occurring off the east coast of Japan.


